Act on critical assets first.
See which high-risk assets fall due within 24 months, their forecast replacement cost and the records that need review.
 Request a quotation
SAMTAP turns the evidence already held against each asset into clearer maintenance, replacement and capital-planning intelligence.
SAMTAP turns condition, age, faults, typical service life and replacement cost into a live view of future capital exposure.
The Executive Summary turns a portfolio-wide model into a short, readable capital position. The action queue then exposes the decisions behind the total: urgent replacements, missing costs and assets where better survey data will improve confidence.
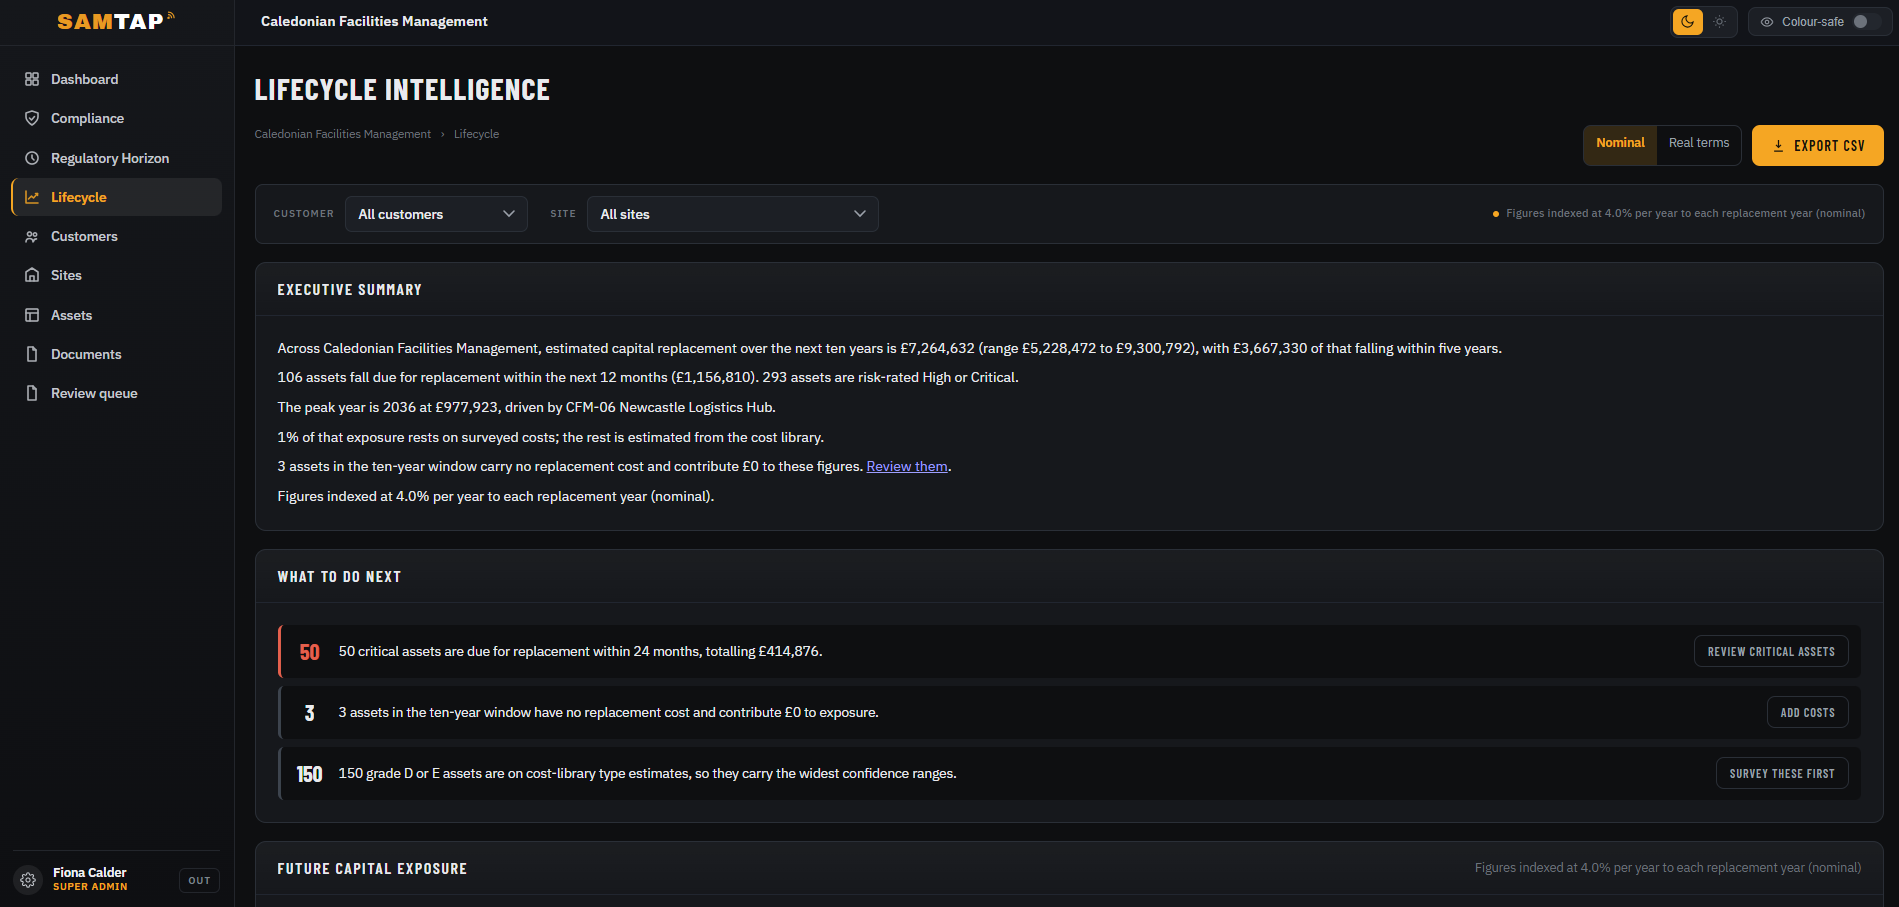
See which high-risk assets fall due within 24 months, their forecast replacement cost and the records that need review.
SAMTAP distinguishes surveyed costs from type estimates and highlights the assets carrying the widest forecast ranges.
Assets without a replacement cost remain explicit and contribute £0 until the information is completed, never hidden inside the total.
Switch the financial basis, apply annual indexing and export a usable CSV for capital planning and board reporting.
Move from the portfolio total to the records driving it. Filter by risk, condition, cost source or confidence, then see the asset, location, adjusted life, replacement year and cost basis behind every figure.
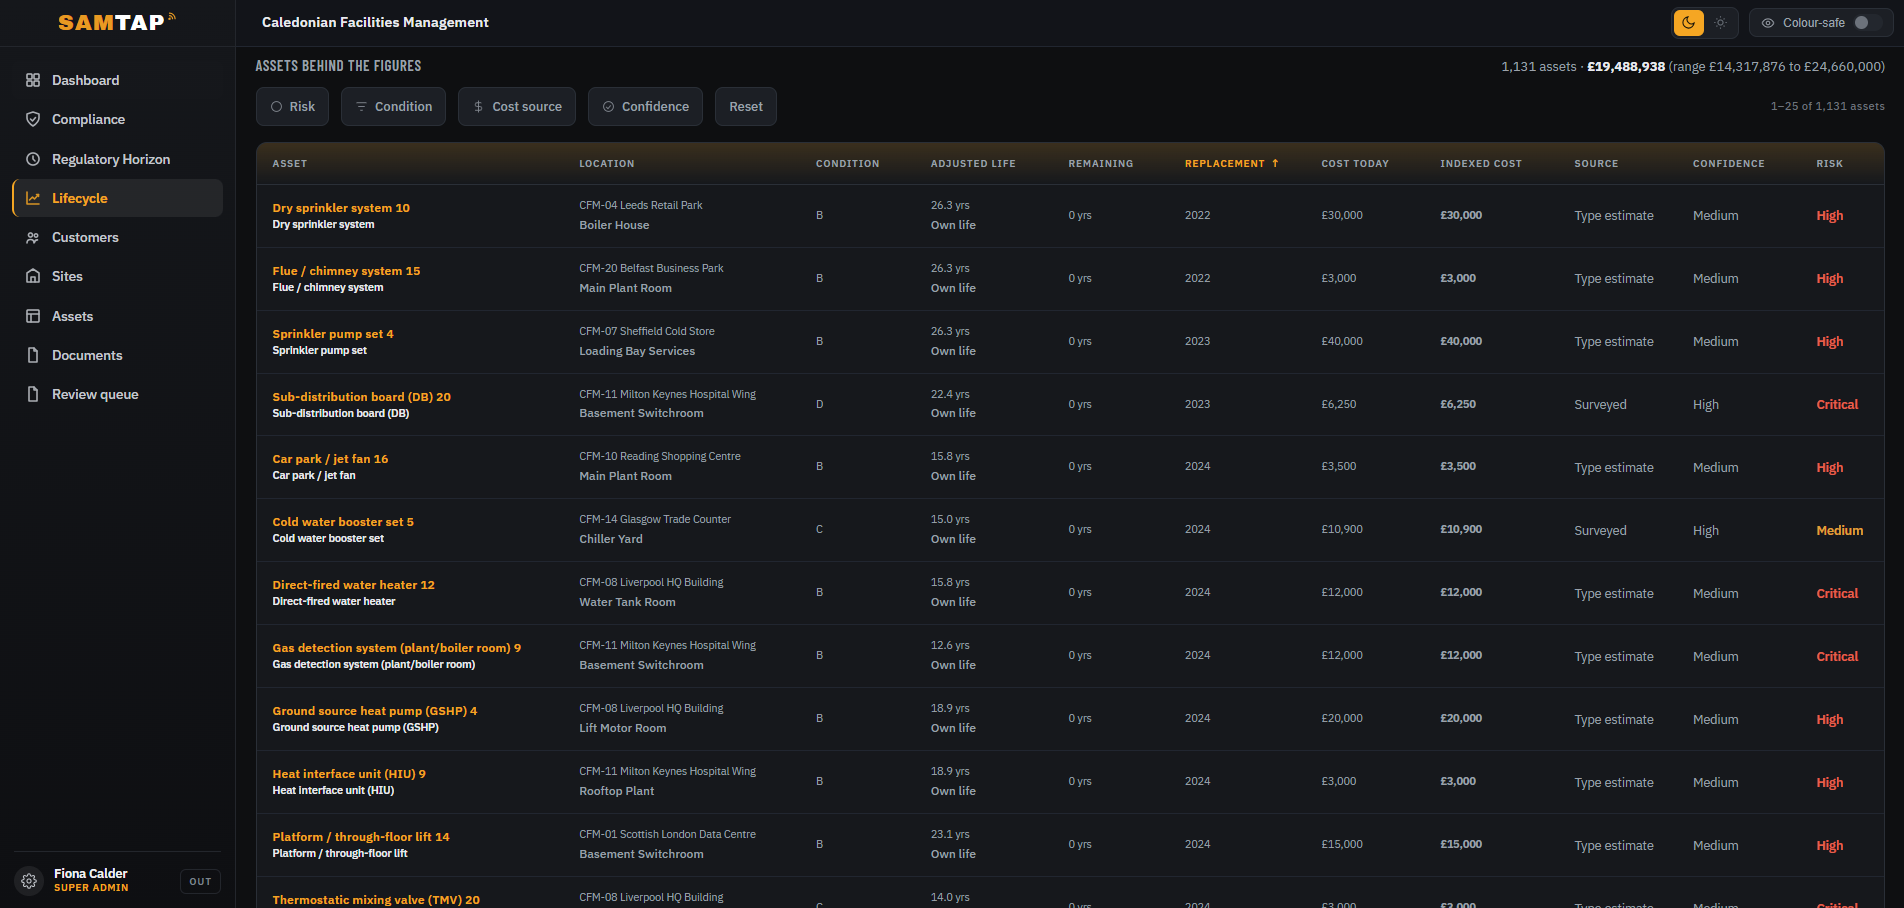
The methodology is visible within SAMTAP, so teams can understand why a replacement falls in a particular year and what would make the forecast more reliable.
Expected service life is adjusted using the recorded condition, then measured against the installation year to calculate remaining life and replacement timing.
A surveyed asset cost is used where one exists. Otherwise SAMTAP uses the relevant cost-library estimate. Records without either remain visible and contribute £0.
Nominal forecasts index costs to the expected replacement year using the live platform rate. Real-term forecasts retain today’s prices.
Confidence bands reflect the source and quality of the data. Surveyed costs carry tighter ranges; estimates and poorer-condition assets carry wider ones.
Out-of-service and decommissioned assets are excluded. Records missing the information needed to calculate a replacement year are flagged for completion, and lifecycle figures are recalculated regularly.
Tell us how many buildings and assets you manage. We’ll come back with a practical starting point and a clear quotation.